
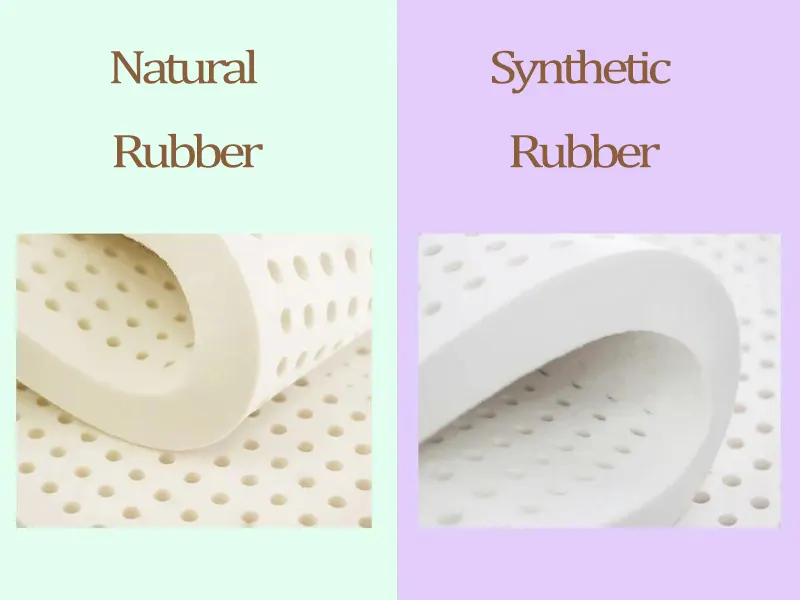
In high-end manufacturing sectors such as latex products, automotive components, aerospace seals, and medical devices, the purity and blending ratio of rubber raw materials directly dictate the physical performance, durability, and commercial value of the final product. Particularly for premium products like natural latex pillows and mattresses, the ratio of Natural Rubber (NR) to Synthetic Rubber (such as SBR or BR) serves as the core benchmark for quality verification and pricing strategies.
However, visual inspection, odor, or basic physical testing cannot accurately differentiate or quantify these rubber polymers once they are fully vulcanized and compounded. To ensure supply chain transparency and meet stringent multinational procurement compliance, advanced independent third-party laboratories typically combine two powerful material characterization techniques: Fourier-Transform Infrared Spectroscopy (FTIR) and Thermogravimetric Analysis (TGA).
This article provides a deep technical dive into how third-party labs utilize the chemical “fingerprinting” of FTIR alongside the “quantitative thermal pyrolytic” capabilities of TGA to cross-verify and precisely calculate the natural-to-synthetic rubber ratio.
Table of Contents
Why a Single Test Method Falls Short of Precision Quantification
To appreciate the necessity of a combined testing approach, one must understand the sheer complexity of a vulcanized rubber matrix. Both natural rubber (Polyisoprene) and common synthetic alternatives like Styrene-Butadiene Rubber (SBR) are high-molecular-weight polymers.
- Natural Rubber (NR): Primarily composed of cis-1,4-polyisoprene, featuring a highly regular molecular chain structure.
- Styrene-Butadiene Rubber (SBR): A copolymer of butadiene and styrene, offering excellent wear resistance and aging stability.
Once these rubbers are blended, vulcanized (cross-linked with sulfur), and heavily loaded with compounding ingredients—such as carbon black, calcium carbonate, plasticizers, oils, and anti-aging agents—the entire matrix becomes an intricately bound network.
- If a lab relies solely on FTIR, it can swiftly identify the types of rubber present (qualitative analysis). However, because infrared absorbance is highly sensitive to sample thickness, surface non-uniformity, and the overlapping IR absorption of inorganic fillers, using it as a standalone quantitative tool yields a high margin of error.
- If a lab relies solely on TGA, it can precisely weigh the total polymer, carbon black, and ash content based on thermal weight loss. However, if the thermal degradation (pyrolysis) temperature windows of the NR and SBR polymers overlap substantially, a standard TGA weight-loss curve cannot cleanly separate them.
Consequently, the dual-protocol approach—“FTIR for Qualitative/Semi-Quantitative Screening + TGA for Precise Pyrolytic Quantification”—has become the globally recognized gold standard among top-tier laboratories (such as SGS, TÜV, and Intertek).
Step 1: FTIR Spectroscopy Analysis — Establishing Chemical Fingerprints
Fourier-Transform Infrared Spectroscopy (FTIR) operates on the principle that when infrared radiation passes through a sample, the molecules absorb specific frequencies of light that match their internal vibrational frequencies (such as C=C, C-H, or C-C bonds). This absorption creates a highly specific spectrum.
Experimental Operation and Pretreatment
Advanced labs generally employ Attenuated Total Reflection (ATR) mode or Transmission mode (via ultra-thin microtome slicing). The ATR mode allows direct measurement by pressing the rubber sample against a high-refractive-index crystal, bypassing complex chemical dissolution and vastly accelerating turnaround times.
Identification of Core Characteristic Peaks
In an FTIR spectrum, NR and SBR display distinctly localized “fingerprint” peaks:
- Natural Rubber (NR) Peaks: A sharp, intense absorption band appears near 833 cm⁻¹, representing the =C-H out-of-plane bending vibration of the cis-1,4-polyisoprene backbone. Additionally, a distinct asymmetric deformation peak of the methyl group (-CH₃) is captured at 1375 cm⁻¹.
- Styrene-Butadiene Rubber (SBR) Peaks: Prominent peaks emerge near 700 cm⁻¹ and 757 cm⁻¹, originating from the out-of-plane bending vibrations of the mono-substituted benzene ring. Concurrently, a peak at 965 cm⁻¹ signifies the trans-1,4 structure of the butadiene component.
Image Recommendation: A comparative diagram showing standard FTIR spectra of pure NR, pure SBR, and an NR/SBR blend.
Visual Focus: Clearly highlight the 833 cm⁻¹ (NR isoprene peak) and 700 cm⁻¹ / 757 cm⁻¹ (SBR benzene ring peaks) regions to demonstrate how peak height/area ratios indicate blending trends.
Absorbance Ratio Method
Once the presence of both polymers is confirmed, lab engineers calculate the absorbance ratio of the key characteristic peaks (e.g., A₈₃₃ / A₇₀₀). By mapping this ratio against a pre-established calibration curve generated from reference standards of known blending ratios, technicians obtain an initial estimation. This approximation directly guides the integration parameters for the subsequent TGA stage.
Step 2: Thermogravimetric Analysis — High-Precision Mass Quantification
While FTIR defines the chemical identities, delivering a high-precision quantitative statement—such as “85% Natural Latex, 15% Synthetic SBR”—requires Thermogravimetric Analysis (TGA).
TGA continuously monitors and records changes in the mass of a sample as a function of temperature or time under a controlled atmosphere (typically starting with an inert nitrogen purge, followed by a switch to an oxidative air or oxygen environment).
[Preheating: Volatiles Removal] ──> [Nitrogen Atmosphere: Polymer Pyrolysis (NR & SBR)] ──> [Air Atmosphere: Carbon Black Burn-off] ──> [Residual Ash: Inorganic Fillers]
Standard TGA Test Profile (Following ASTM E1131 / ISO 9924)
- Sampling: A micro-sample of 5–10 mg is precisely weighed and placed into a platinum or alumina crucible.
- Thermal Ramp Phase 1 (Nitrogen Atmosphere, Room Temp to ~550°C–600°C):
- Between 300°C and 450°C, the molecular chains of Natural Rubber (NR) degrade and volatilize completely.
- Between 420°C and 500°C, the thermally more resilient Styrene-Butadiene Rubber (SBR) undergoes pyrolysis.
- The total mass lost during this entire phase equates to the Total Rubber Polymer (Hydrocarbon) fraction.
- Thermal Ramp Phase 2 (Atmosphere Switch to Air/Oxygen, up to 800°C):
- With the rubber matrix fully vaporized, oxygen reacts with the remaining carbonaceous matter, burning off the Carbon Black.
- The unburnable residue left at the bottom of the crucible represents the Ash / Inorganic Fillers (e.g., silicates, calcium carbonate, titanium dioxide).
Image Recommendation: A typical TGA (Weight loss) and DTG (Derivative weight loss) thermogram of an NR/SBR rubber compound.
Visual Focus: The Y-axis showing mass percentage (%) and rate of mass loss (%/min), with the X-axis tracking temperature (°C). Clearly delineate the steps: Volatiles, Polymer Pyrolysis, Carbon Black Combustion, and Ash Residue.
Step 3: Mathematical Modeling and Gaussian Deconvolution of Overlapping Peaks
In real-world testing, the primary challenge for analytical scientists is that the tail end of NR’s degradation profile overlaps with the initiation of SBR’s degradation. On a standard TGA weight-loss curve (TG), this manifests as a continuous, steep slope without a clean, distinct plateau between the two polymers.
To isolate the two components, laboratories look at the DTG (Derivative Thermogravimetry) curve, which plots the first derivative of mass loss against temperature. The DTG curve effectively translates a sloped weight drop into distinct, manageable “degradation rate peaks.”
Gaussian/Lorentzian Deconvolution
Because the degradation peaks of NR and SBR are closely conjoined, advanced laboratory software suites (such as TA Instruments’ Universal Analysis or Netzsch’s Proteus) apply mathematical deconvolution algorithms:
- The composite DTG curve of the blended compound is imported.
- A Gaussian/Lorentzian distribution profile modeled on pure NR degradation (peaking around 380°C) is assigned.
- A secondary profile modeled on pure SBR degradation (peaking around 450°C) is assigned.
- The software runs iterative curve-fitting calculations to separate the combined peak into two distinct, independent single peaks.
$$Area_{Total} = Area_{NR} + Area_{SBR}$$
By computing the integrated area under each individual deconvoluted peak, the lab determines the precise mass percentage of natural rubber relative to synthetic rubber within the polymer matrix.
Image Recommendation: A visual schematic of the DTG peak-fitting / deconvolution process.
Visual Focus: Show the original combined experimental DTG peak as a dashed line, and the two mathematically resolved, color-coded curves representing individual NR and SBR degradation profiles, along with their respective integrated area percentages.
Establishing Lab-Internal Calibration Curves
To guarantee absolute accuracy, advanced testing facilities do not rely solely on software-automated theoretical calculations. They maintain a rigorous empirical calibration framework.
Labs synthesize an internal gradient matrix of standard reference materials using pure natural latex (100% NR) and pure synthetic styrene-butadiene latex (100% SBR):
- Standard A: 90% NR / 10% SBR
- Standard B: 80% NR / 20% SBR
- Standard C: 70% NR / 30% SBR
- Standard D: 50% NR / 50% SBR
These reference samples are processed under identical FTIR and TGA operational parameters to construct a linear regression calibration curve mapping the “Actual Blending Ratio vs. FTIR Absorbance Ratio / TGA Deconvoluted Area Ratio.” When a client’s unknown sample is tested, its raw data is interpolated into this regression equation, effectively neutralizing equipment systematic errors and any thermal interference caused by proprietary compounding additives.
Full Case Walkthrough: Verifying a Premium Latex Pillow
To demonstrate the real-world execution of this methodology, let us examine a typical evaluation of a high-end consumer product:
Sample Description: An imported latex pillow marketed as containing “93% Natural Latex.”
| Testing Phase | Analytical Procedure | Experimental Findings & Data Breakdown |
| Phase 1 | FTIR Screening | An intense polyisoprene band forms at $833\text{ cm}^{-1}$. However, a faint but indisputable benzene ring signature is detected at $700\text{ cm}^{-1}$. Finding: The sample is not 100% natural rubber; synthetic SBR is definitively present. |
| Phase 2 | TGA Proximate Analysis | The total mass of the sample is categorized via thermal decomposition as: • Volatiles (Moisture/Process Oils): 2.5% • Total Rubber Polymer (Hydrocarbons): 91.0% • Fillers & Inorganic Ash: 6.5% |
| Phase 3 | DTG Deconvolution | The 91.0% total polymer mass peak is mathematically resolved via software: • Natural Rubber (NR) peak area fraction: 85.5% • Synthetic Rubber (SBR) peak area fraction: 14.5% |
| Phase 4 | Final Formulation Conversion | Natural Rubber Ratio within the pure polymer core = $85.5\% \div 91.0\% = \mathbf{93.95\%}$. Conclusion: Within the total rubber content, the natural latex proportion measures approximately 94%, validating the brand’s premium product claim. |
Image Recommendation: A wide-angle view of a modern third-party analytical chemistry laboratory, highlighting parallel analytical instruments (FTIR and TGA) with a technician examining spectra on a dual-monitor workstation.
Visual Focus: Project an atmosphere of professional-grade compliance, precision instrumentation, and rigorous quality assurance.
Conclusion: Leveraging Analytical Data for Enterprise Excellence
Understanding the cross-functional capabilities of FTIR and TGA testing offers substantial strategic benefits for manufacturing quality control (QC) and international sourcing:
- Mitigating Raw Material Fraud: Establishing routine testing protocols prevents upstream compounding facilities from secretly cutting natural latex with inexpensive, petroleum-derived synthetic polymers.
- Ensuring Global Regulatory Compliance: Major consumer markets (such as the EU and North America) enforce strict truth-in-advertising laws regarding organic and natural material declarations. A verified FTIR+TGA test report provides an unassailable compliance shield.
- Optimizing Product R&D: Product development teams can utilize TGA to map out the exact ratios of polymers, structural carbon blacks, and mineral extenders. This enables precise engineering adjustments to match mechanical elasticity performance goals while maintaining optimal cost structures.
By dissecting material profiles down to their molecular fingerprints and thermal mass behavior, advanced laboratory testing ensures supply chain transparency and builds consumer trust in global high-end manufacturing.